Graphical User Interface
| |||||
This section provides an overview of the different elements of the graphical user interface for interacting with the VirtualLabs simulation engine.
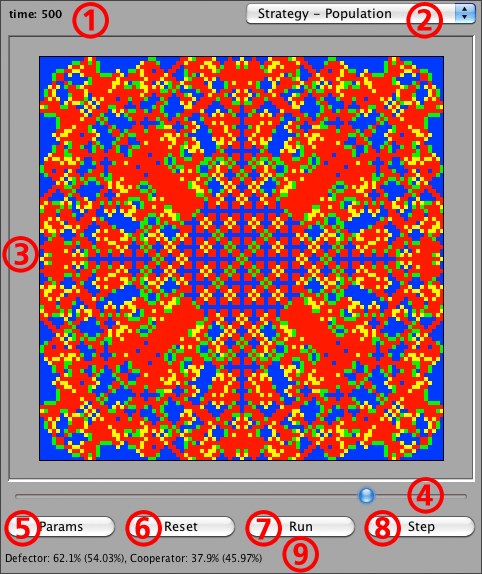
Different elements of the VirtualLabs interface.
 Elapsed time
Indicates the time elapsed since the start of the simulations or numerical calculations. For simulations, the time is measured in units of Monte-Carlo steps (MC steps). If the population size is [math]\displaystyle{ N }[/math], then an MC step consists of [math]\displaystyle{ N }[/math] individual updates. For numerical the integration of ordinary differential equations (ODE), the time increment is automatically chosen by the integrator (Fifth-order Runge-Kutta method with adaptive step size). For numerical integration of partial differential equations (PDE), the time increment is an adjustable parameter. Similarly, the time between subsequent reports of the state of the population can be customized.
 Select different data views
For a better understanding of the progress of the simulations or numerical calculations, the current state of the population can be presented in a number of different ways. This is very valuable to generate a deeper intuitive understanding of the dynamics. The number and type of data views available depends on the type of model.
 View of the data
Here the different types of reports for the current state of the system are shown. This example depicts the state of a simulation run of the spatial Snowdrift game after 500 MC steps. Individuals are arranged on a rectangular [math]\displaystyle{ 101\times101 }[/math] lattice and interact only with their four nearest neighbors to the north, south, east and west. The different colors indicate the strategy of each individual - in the present case, these are cooperators and defectors:
| Color code: | Cooperators | Defectors |
|---|---|---|
| New cooperator | New defector |
The initial configuration is symmetric (a single defector in the center of a sea of cooperators) and the update rule is deterministic such that the symmetry is preserved. This produces fascinating evolutionary kaleidoscopes or dynamic persian carpets.
If simulations or numerical calculations are running, clicking in this area interrupts (pauses) the execution and has the same effect as the Stop-button. If no simulations are running, mouse-clicks can have different effects depending on the selected type of view displayed. For lattice games and a discrete set of strategies (e.g. to cooperate or to defect as in the depicted example) a click alters the strategy of the corresponding lattice site. If there are several strategies, multiple clicks rotate through all possibilities. For views depicting the phase plane (e.g. in the Simplex [math]\displaystyle{ S_3 }[/math] of public goods games with voluntary participation) clicks temporarily set the frequencies of all strategies to enable efficient explorations of the dynamics in the phase space. Moreover, for running ODE calculations, a mouse click stops forward integration and calculations proceed with backwards integration.
Hovering with the mouse over the different data views displays further information about the current state of the population in the form of a 'tool tip'. Again, the details of the information provided depend on the type of report displayed. For the present example of lattice games, placing the mouse pointer over a site displays the strategy at that site, its payoff, number of interactions, interaction partners etc. For phase planes it displays the fractions of each strategy at that particular location. This information is continuously updated if calculations are running.
Further details on the presentation of the data, available manipulations using the mouse and additional information accessible through tool tips triggered by the mouse pointer are provided together with the detailed description of the different data views.
 Speed of calculations
For running simulations or numerical calculations the slider sets the delay between subsequent updates. Delays are large on the left and minimal on the right. On the left, simulations or numerical calculations are suspended between updates for approximately 2 seconds. On far right they are running without delay and the time between updates depends on various factors including the report frequency, the population size and the CPU power of the computer.
 Display parameter panel
Numerous parameters are adjustable to fine tune the simulations and numerical calculations and to explore the often rich dynamical features of evolutionary systems. Please refer to the detailed description of the different parameters.
 Reset
Reset
Resets and re-initializes the simulations and numerical calculations. This includes resetting time, re-initializing the population according to the settings specified in the parameters panel. For structured populations that require random links between individuals to generate (e.g. random graphs), a new population structure is generated.
 Start/Stop/Continue
Starts, pauses or resumes simulations or numerical calculations. It toggles whether the VirtualLabs engine is running or idling. If the engine is idle, Run indicates that the engine is ready to start or continue calculations, whereas while the engine is running, the button displays Stop and interrupts the calculations.
 Next
Next
Displays the next state of the population. The step size depends on the report frequency and possible on the time increment for PDE's. In addition, the required CPU time for one step depends on the population size [math]\displaystyle{ N }[/math].
 Status messages
In this area different kinds of information is displayed. Upon startup it shows the version of the graphical front end as well as of the engine. If the VirtualLabs engine encounters difficulties (e.g. incompatible parameter settings) then a warning is shown. More detailed information on the type of problem - and potential countermeasures - is available on the console log. The standard display summarizes the current state of the population. For discrete strategies this is the average frequency of each strategic type (the value in brackets indicates the long term average since the start of the simulations). For continuous strategies it displays the minimum, mean and maximum value of the strategic trait in the population.