Moran graphs

Moran graphs mark an important reference point in evolutionary graph theory because they maintain the balance between selection and random drift of the original Moran process. For those graphs the spatial Moran process leaves the fixation probabilities of a mutant unchanged and identical to the original Moran process in unstructured, well-mixed populations. Rather surprisingly it turns out that this applies to a large class of graphs, called circulations.
Mathematically, the structure of the graph is determined by the adjacency matrix \(\mathbf{W} = [w_{ij}]\) where \(w_{ij}\) denotes the strength of the link pointing from vertex \(i\) to vertex \(j\). If \(w_{ij} =0\) and \(w_{ji} =0\) then the two vertices \(i\) and \(j\) are not connected. In order to characterize circulations, let us introduce the flux through each vertex. The sum of the weights of the incoming links \(f_i^\text{in}=\sum_j w_{ji}\) denotes the flux entering vertex \(i\). \(f_i^\text{in}\) relates to a temperature because it indicates the rate at which the occupant of vertex \(i\) gets replaced. ‘Hot’ vertices are frequently replaced and ‘cold’ vertices are only rarely updated. In analogy, the sum of the weights of the outgoing links \(f_i^\text{out}=\sum_j w_{ij}\) denotes the flux leaving vertex \(i\). \(f_i^\text{out}\) determines the impact of vertex \(i\) on its neighborhood. All graphs, which satisfy \(f_i^\text{in}=f_i^\text{out}\) for all vertices, are circulations. With this we can state a remarkable theorem:
- Circulation Theorem: The Moran process on a graph results in the same fixation probability \(\rho_1\) of a single mutant as in an unstructured population if the graph is a circulation.
An illustrative sketch of the proof follows below. In contrast to unstructured (well-mixed) populations, the state of a structured population is not simply determined by just the number of mutants (or residents) but rather needs to take the distribution of mutants and residents into account. Rather surprisingly, however, it turns out that for circulations the spatial distribution of mutants and residents does not affect their fixation probabilities. The observation that fixation probabilities remain unchanged for diverse population structures forms the basis for the conjecture by Maruyama (1970) and Slatkin (1981) speculating that population structure does not affect fixation probabilities. Indeed this is true for structures as diverse as complete graphs (every vertex is connected to every other vertex), lattices or random regular graphs.
Last but not least, the circulation theorem indirectly suggests that some population structures do affect fixation probabilities. Thus, it becomes an intriguing question what population structures may act as evolutionary suppressors that suppress selection and enhance random drift (\(\rho<\rho_1\) for \(r > 1\)) or, conversely, as evolutionary amplifiers that enhance selection and suppresses random drift (\(\rho>\rho_1\) for \(r > 1\)).
Evolutionary dynamics on Moran graphs
Even though the fixation probability is the same for all circulations, the invasion dynamics of mutants depends on structural details of different kinds of circulation graphs. In particular, the local structure of a graph determines or constrains the proliferation opportunities of a mutant and hence affects the spreading of a mutant trait.

Evolutionary dynamics on the complete graph
The complete graph is essentially identical to the original Moran process in an unstructured population. Every vertex is connected to every other one and hence the degree of the complete graph is \(k=N-1\). This means every offspring can replace any other vertex except its parent, which is indeed the only difference between the spatial Moran process on the complete graph and the original Moran process. Nevertheless, in principle, this could also be implemented in the graph structure by adding loops to each vertex. Because mutants can spread to any part of the graph in a single step, the invasion process progresses quickly and does not exhibit characteristic patterns.
Evolutionary dynamics on the cycle graph
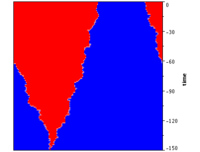
On the cycle graph every vertex is connected to its two neighbours to the left and right. This corresponds to a linear graph or 1D lattice with periodic boundary conditions. The invasion dynamics is highly constrained and mutant proliferation is restricted to the left and right ends of a single connected cluster of mutants. Consequently the invasion speed is much slower than on the complete graph.
Evolutionary dynamics on the rectangular lattice
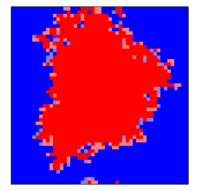
Rectangular lattices or 2D lattices are often used to represent spatial dimensions. However, in order to reduce finite size effects periodic boundary conditions are often assumed, i.e. the rectangular lattice is arranged on a torus. Moreover this is a convenient way to ensure that the lattice is regular, i.e. all vertices have the same number of neighbours (otherwise the lattice would also not qualify as a circulation). In contrast to the 1D lattice or cycle, a cluster of mutants can now split into two or conversely two clusters can merge into one. On rectangular lattices, mutants typically invade by forming a compact, expanding cluster with a frazzled boundary. The width of the frazzled zone increases for decreasing fitness differences between residents and mutants. Smaller fitness differences also increase the chance that the initial cluster of mutants gets split into several smaller ones.

Evolutionary dynamics on random regular graphs
Random regular graphs are random networks where each vertex has the same degree \(k\) (number of neighbours) and approximate Cayley trees or Bethe lattices for finite \(N\). Due to the random structure no distinctive invasion patterns can form and the invasion process is similar to the complete graph despite the far fewer links, albeit a little slower because of the fewer links.
Fixation probabilities on Moran graphs
The definition of Moran graphs is that those population structures do not affect fixation probabilities of a mutant and actually conserve the fixation probabilities of the original Moran process in unstructured populations. Moreover, the fixation probability is also independent of the location of the initial mutant. The following simulations illustrate this result for rather diverse examples of circulations.
Fixation probabilities on the complete graph
The fixation probabilities for mutants on any circulation are the same and the same as in the original Moran process. The simulations confirm this result for the complete graph, which is closest to an unstructured population.
Fixation probabilities on the cycle graph
The invasion dynamics of mutants on the cycle graph is rather different from the invasion on a complete graph. For example, opportunities for the mutant to spread through the population are severely limited. At all times, mutants are confined to a single connected cluster. Nevertheless and in spite of these differences, the fixation probability of a mutant remains unchanged.
Fixation probabilities on the rectangular lattice
In contrast to the cycle graph (or 1D lattice), the initial mutant cluster can split into several disconnected clusters on rectangular (2D) lattices and separate clusters can merge into one. Again this does not affect the fixation probabilities of mutants. Note the rectangular lattice must be regular, i.e. all vertices must have the same number of neighbours - otherwise the graph would not qualify as a circulation. Usually this is implemented by introducing periodic boundary conditions.
Fixation probabilities on random regular graphs
The invasion dynamics on random regular graphs is similar to the complete graph in spite of fewer links. Simulations below illustrate that this does affect the fixation times but again leaves the fixation probabilities of a mutant unchanged.
Fixation times on Moran graphs
According to their definition, mutations on Moran graphs maintain the same fixation probabilities as in the original Moran process in unstructured populations. However, this has no implications on the fixation times of a mutant or on the absorption time, i.e. the time until the population reaches either one of the absorbing states with all mutants or all residents. In fact, fixation and absorption times vary greatly even between different circulation graphs, as illustrated with the following simulations for diverse examples of circulations. Moreover, even on circulation graphs fixation times in general also depend on the location of the initial mutant. Only sufficiently symmetrical graphs can at least ensure that fixations times do not depend on the location of the initial mutant. However, even then fixation times differ between different graphs.
Even though to date rigorous connections between structural features and fixation times are lacking, the diameter of a graph correlates with fixation times. The diameter of a graph \(d\) is defined as the longest shortest path between any two vertices and provides a measure for how many updates are at least required until the progeny of any one particular vertex could occupy any other vertex. Other, related measures such as the radius of a graph or the average shortest distance seem to work equally well.
Fixation times on the complete graph
Since the complete graph is essentially identical to an unstructured population, it is little surprise that the fixation and absorption times also essentially remain the same. In particular, the complete graph is the only graph whose diameter does not depend on its size \(N\) and remains constant \(d=1\). Possibly the fixation times on the complete graph are the shortest on any circulation with undirected links or even on any graph.
Fixation times on the cycle graph
In contrast to the complete graph, opportunities for mutants to spread on the cycle graph are severely limited. Consequently, fixation times are much longer. The diameter of a cycle graph is \(d=[N/2]\), where \([x]\) denotes the largest integer smaller than \(x\). Quite possibly the fixation times on the cycle graph are the longest for any circulation with undirected links.
Fixation times on the rectangular lattice
On the rectangular lattice fixation times lie between the extremes of the complete graph and the cycle graph. The diameter of rectangular lattice scales as \(d\sim\sqrt{N}\) but the actual value depends on the degree of the vertices, i.e. whether the lattice reflects a von Neumann neighbourhood, \(k=4\), or a Moore neighbourhood, \(k=8\), or includes an even larger range of neighbours.
Fixation times on random regular graphs
Fixations times on random regular graphs are much smaller than on a rectangular lattice of the same size \(N\) and the same degree \(k\). The reason is that it is much easier for mutant offspring to reach distant corners on a random regular graph than on a lattice. Even for small \(k\) every vertex can be reached from every other vertex with relatively few steps. This is also reflected in the diameter of random regular graphs, which scales as \(d\sim\ln N\).
Fixation probability on circulation graphs

At any point in time during the invasion process of mutants on a circulation graph, it is possible to identify connected subsets of vertices on the graph that are occupied by mutants such that all adjacent vertices of each subset are occupied by residents. Obviously, the state of the population changes only if a replacement occurs along one of the links connecting residents and mutants (see figure). Multiple such subsets may exist and, in fact, the evolutionary process may split large connected subsets of mutants into two smaller ones or may merge two previously unconnected subsets into one larger subset. For each subset, the circulation theorem establishes that the sum of the weights of links pointing out of the subset (connecting a mutant vertex to an adjacent resident vertex) equals the sum of the weights of links pointing into the subset (connecting an adjacent resident with a mutant vertex within the subset). Since the influx is balanced by the outflux, \(f_i^\text{in}=f_i^\text{out}\), for all vertices, increasing the mutant subset by replacing an adjacent resident vertex with a mutant or decreasing the subset by replacing a mutant with a resident, does not affect the flux balance of the subset. For the same reason, the balance remains unchanged if subsets merge or if one subset splits into two.
Recall that the number of mutants in the population changes only if a replacement occurs along any link that connects residents with mutants or vice versa. Because the Moran process essentially selects links with a probability proportional to the link weight and the fitness of the vertex at its tail, it follows that for each subset, the probability that another mutant is added is simply given by \(r/(1 + r)\) and the complementary probability to remove one mutant is \(1/(1 + r)\). Since this holds for each subset, it also holds for the entire population and is independent of the number, size, shape and distribution of mutant subsets. This invariance applies only if the circulation theorem is satisfied. Consequentially, the fixation probability on circulation graphs reduces to the recursive equation derived for the original Moran process.
Note that even though the fixation probabilities remain unchanged on circulation graphs, the corresponding fixation times are very sensitive to the details of the population structure and pose a much harder problem. Moreover, fixation times generally depend on the location of the initial mutant. Only additional structural symmetries can ensure that the fixation times are independent of the location on one graph but not across different graphs. The circulation theorem only ensures that the ratio of the transition probabilities \(T_i^+/T_i^− = r\) remains unchanged, i.e. independent of the number of mutants \(i\) and their distribution. However, even on circulation graphs both \(T_i^+\) and \(T_i^−\) depend not only on the number but also on the distribution of mutants but those effects cancel for their ratio. Generally, population structures tend to substantially increase the fixation times because the structure limits the possibilities for mutants to conquer new vertices.
Publications
- Lieberman, E., Hauert, C. & Nowak, M. (2005) Evolutionary dynamics on graphs Nature 433 312-316 doi: 10.1038/nature03204.
References
- Maruyama, T. (1974) A Simple Proof that Certain Quantities are Independent of the Geographical Structure of Population Theor. Pop. Biol. 5 148-154.
- Slatkin, M. (1981) Fixation probabilities and fixation times in a subdivided population Evolution 35 477-488.