Evolutionary graph theory: Difference between revisions
No edit summary |
No edit summary |
||
| Line 14: | Line 14: | ||
== [[Evolutionary graph theory/Moran graphs|Moran graphs]] == | == [[Evolutionary graph theory/Moran graphs|Moran graphs]] == | ||
[[Image:Moran graph (lattice).png|thumb|200px|On lattices a single mutant has the same fixation probability as in an unstructured population.]] | [[Image:Moran graph (lattice).png|thumb|200px|On lattices a single mutant has the same fixation probability as in an unstructured population.]] | ||
Population structure can be introduced by assuming that the individuals occupy the nodes of a graph. The adjacency matrix \(W = [w_{ij}]\) then determines the structure of the graph, where \(w_{ij}\) denotes the probability that individual \(i\) places its offspring into node \(j\). If \(w_{ij} = w_{ji} = 0\) then the nodes \(i\) and \(j\) are not connected. Interestingly, the fixation probability remains unaffected for a large class of population structures (graphs known as circulations), i.e. is the same as for the original [[#Moran process|Moran process]] in unstructured populations | Population structure can be introduced by assuming that the individuals occupy the nodes of a graph. The adjacency matrix \(W = [w_{ij}]\) then determines the structure of the graph, where \(w_{ij}\) denotes the probability that individual \(i\) places its offspring into node \(j\). If \(w_{ij} = w_{ji} = 0\) then the nodes \(i\) and \(j\) are not connected. Interestingly, the fixation probability remains unaffected for a large class of population structures (graphs known as circulations), i.e. is the same as for the original [[#Moran process|Moran process]] in unstructured populations. For a single mutant this is | ||
\[ | \[ | ||
\rho_1 = \frac{\displaystyle 1-\frac1r}{\displaystyle 1-\frac1{r^N}}. | \rho_1 = \frac{\displaystyle 1-\frac1r}{\displaystyle 1-\frac1{r^N}}. | ||
| Line 23: | Line 23: | ||
== [[Evolutionary graph theory/Evolutionary suppressors|Evolutionary suppressors]] == | == [[Evolutionary graph theory/Evolutionary suppressors|Evolutionary suppressors]] == | ||
[[Image:Evolutionary suppressor (chain).png|thumb|200px|Evolutionary suppressors are structures that reduce selection and enhance random drift, i.e. the fixation probability of advantageous (deleterious) mutants is decreased (increased) as compared to unstructured populations.]] | [[Image:Evolutionary suppressor (chain).png|thumb|200px|Evolutionary suppressors are structures that reduce selection and enhance random drift, i.e. the fixation probability of advantageous (deleterious) mutants is decreased (increased) as compared to unstructured populations.]] | ||
The characteristic balance between selection and drift in Moran graphs can tilt to either side for graphs that are not circulations. For example, suppose \(N\) individuals are arranged in a linear chain. Each individual places its offspring into the position immediately to its right. The leftmost individual is never replaced. The mutant can only reach fixation if it arises in the leftmost position, which happens with probability \(1/N\), but then it will eventually reach fixation with certainty. Clearly, for such one-rooted graphs the fixation probability of a randomly placed mutant is | The characteristic balance between selection and drift in Moran graphs can tilt to either side for graphs that are not circulations. For example, suppose \(N\) individuals are arranged in a linear chain. Each individual places its offspring into the position immediately to its right. The leftmost individual is never replaced. The mutant can only reach fixation if it arises in the leftmost position, which happens with probability \(1/N\), but then it will eventually reach fixation with certainty. Clearly, for such one-rooted graphs the fixation probability of a single, randomly placed mutant is | ||
\[ | \[ | ||
\rho_0 = \frac1N, | \rho_0 = \frac1N, | ||
| Line 32: | Line 32: | ||
== [[Evolutionary graph theory/Evolutionary amplifiers|Evolutionary amplifiers]] == | == [[Evolutionary graph theory/Evolutionary amplifiers|Evolutionary amplifiers]] == | ||
[[Image:Evolutionary amplifier (star).png|thumb|200px|Evolutionary amplifiers are structures that enhance (suppress) the fixation probability of advantageous (deleterious) mutants as compared to unstructured populations.]] | [[Image:Evolutionary amplifier (star).png|thumb|200px|Evolutionary amplifiers are structures that enhance (suppress) the fixation probability of advantageous (deleterious) mutants as compared to unstructured populations.]] | ||
Interestingly, it is also possible to create population structures that amplify selection and suppress random drift. For example, on the star structure, where all nodes are connected to a central hub and vice versa, the fixation probability of a randomly placed mutant becomes | Interestingly, it is also possible to create population structures that amplify selection and suppress random drift. For example, on the star structure, where all nodes are connected to a central hub and vice versa, the fixation probability of a single, randomly placed mutant becomes | ||
\[ | \[ | ||
\rho_2 = \frac{\displaystyle 1-\frac1{r^2}}{\displaystyle 1-\frac1{r^{2N}}}. | \rho_2 = \frac{\displaystyle 1-\frac1{r^2}}{\displaystyle 1-\frac1{r^{2N}}}. | ||
| Line 76: | Line 76: | ||
==Publications== | ==Publications== | ||
#Lieberman, E., Hauert, C. & Nowak, M. (2005) Evolutionary dynamics on graphs ''Nature'' '''433''' 312-316 [http://dx.doi.org/10.1038/nature03204 doi: 10.1038/nature03204]. | #Lieberman, E., Hauert, C. & Nowak, M. (2005) Evolutionary dynamics on graphs ''Nature'' '''433''' 312-316 [http://dx.doi.org/10.1038/nature03204 doi: 10.1038/nature03204]. | ||
#Hauert, C. (2008) Evolutionary Dynamics p. 11-44 in ''Evolution from cellular to social scales'' eds. Skjeltorp, A. T. & Belushkin, A. V., Springer Dordrecht NL. | |||
#Jamieson-Lane, A. & Hauert, C. (2015) Fixation probabilities on superstars, revisited and revised ''J. Theor. Biol.'' '''382''' 44-56 [http://dx.doi.org/10.1016/j.jtbi.2015.06.029 doi: 10.1016/j.jtbi.2015.06.029]. | #Jamieson-Lane, A. & Hauert, C. (2015) Fixation probabilities on superstars, revisited and revised ''J. Theor. Biol.'' '''382''' 44-56 [http://dx.doi.org/10.1016/j.jtbi.2015.06.029 doi: 10.1016/j.jtbi.2015.06.029]. | ||
Revision as of 19:24, 13 July 2016
Evolutionary dynamics act on populations. Neither genes, nor cells, nor individuals but populations evolve. In small populations, random drift dominates, whereas large populations are sensitive to subtle differences in selective values. Traditionally, evolutionary dynamics was studied in the context of well-mixed or spatially extended populations. Here we generalize population structure by arranging individuals on a graph. Each vertex represents an individual. The fitness of an individual denotes its reproductive rate, which determines how often offspring is placed into adjacent vertices.
Popular population structures include well-mixed (or 'unstructured') populations, which correspond to fully connected (or complete) graphs or populations with spatial dimensions that are represented by lattices. Other, more general population structures include small-world or scale-free networks.
The dynamics of selection and random drift in finite populations is traditionally modelled by the Moran process. This process has the nice feature that the population size is preserved.
In the following, we study the simplest possible question: what is the probability that a single mutant generates a lineage that takes over the entire population? This fixation probability determines the rate of evolution. The higher the correlation between the mutant's fitness and its probability of fixation, the stronger the effect of natural selection; if fixation is largely independent of fitness, drift dominates.
A large class of graphs exhibit a characteristic balance between selection and drift as characterised by the circulation theorem. Nevertheless, the structure of the graphs can have tremenduous effects on the fixation probability of mutant ranging from complete suppression of selection to complete suppression of random drift, i.e. amplification of selection. If, in addition, individuals interact with their neighbors, reflecting frequency dependent fitness, the dynamics becomes very complicated but first studies show very interesting and counterintuitive results.
Moran graphs

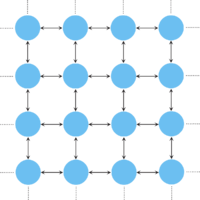
Population structure can be introduced by assuming that the individuals occupy the nodes of a graph. The adjacency matrix \(W = [w_{ij}]\) then determines the structure of the graph, where \(w_{ij}\) denotes the probability that individual \(i\) places its offspring into node \(j\). If \(w_{ij} = w_{ji} = 0\) then the nodes \(i\) and \(j\) are not connected. Interestingly, the fixation probability remains unaffected for a large class of population structures (graphs known as circulations), i.e. is the same as for the original Moran process in unstructured populations. For a single mutant this is \[ \rho_1 = \frac{\displaystyle 1-\frac1r}{\displaystyle 1-\frac1{r^N}}. \] This holds, for example, for the fixation probabilities of mutants on lattices.
Evolutionary suppressors

The characteristic balance between selection and drift in Moran graphs can tilt to either side for graphs that are not circulations. For example, suppose \(N\) individuals are arranged in a linear chain. Each individual places its offspring into the position immediately to its right. The leftmost individual is never replaced. The mutant can only reach fixation if it arises in the leftmost position, which happens with probability \(1/N\), but then it will eventually reach fixation with certainty. Clearly, for such one-rooted graphs the fixation probability of a single, randomly placed mutant is \[ \rho_0 = \frac1N, \] irrespective of \(r\). The chain is an example of a simple population structure which eliminates selection and whose dynamic is determined by random drift.
Evolutionary amplifiers

Interestingly, it is also possible to create population structures that amplify selection and suppress random drift. For example, on the star structure, where all nodes are connected to a central hub and vice versa, the fixation probability of a single, randomly placed mutant becomes \[ \rho_2 = \frac{\displaystyle 1-\frac1{r^2}}{\displaystyle 1-\frac1{r^{2N}}}. \] for large \(N\). Thus, any selective difference \(r\) is amplified to \(r^2\). Even more intriguingly, population structures exist that act as arbitrarily strong amplifiers of selection and suppressors of random drift. However, note that amplification has its price in that the average fixation time goes to infinity as the amplification increases.
Moran process
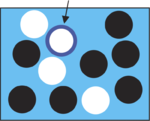
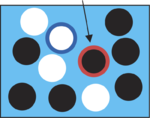
The Moran process describes the stochastic evolution in a finite, unstructured (well-mixed) population of constant size \(N\), which is composed of residents (white) and mutants (black):

Setup: The state of the population is given by the number of residents and mutants.

Step 1: At each time step a focal individual is chosen for reproduction with a probability proportional to its fitness (here, resident is selected for reproduction).

Step 2: A randomly chosen individual is eliminated (here, mutant is selected for death).

Step 3: The offspring replaces the eliminated individual.
This process is repeated until either one of the two absorbing states is reached: a homogeneous state of either all residents (mutant went extinct) or all mutants (resident displaced). No other stable equilibrium state is possible. Whenever an absorbing state is reached, mutants (residents) are said to have reached fixation. The corresponding fixation probability and fixation time are important markers to characterize the evolutionary process. The Moran process represents a specific balance between selection and drift: advantageous mutations have a certain chance - but no guarantee - of fixation, whereas disadvantageous mutants are likely - but again, no guarantee - to become extinct.
Fixation probability
In unstructured populations the state of the population is fully determined by the number of mutants \(i\), which changes at most by \(\pm 1\) in every time step of the Moran process. With probability \(T^+\) the number of mutants increases from \(i\) to \(i+1\), with probability \(T^-\) it decreases to \(i-1\) and with probability \(1-T^+-T^-\) the number of mutants remains unchanged. \begin{align} T^+ &= \frac{i\cdot r}{i\cdot r+(N-i)}\cdot\frac{N-i}N\\ T^- &= \frac{N-i}{i\cdot r+(N-i)}\cdot\frac iN \end{align} The first factor of \(T^+\) (\(T^-\)) indicates the probability that a mutant (resident) is chosen for reproduction and the second factor denotes the probability that the offspring replaces a resident (mutant). Note that the ratio of the transition probabilities \(T^+/T^- = r\) is independent of the number of mutants in the population. This leads to a simple recursive formula for the fixation probability \(\rho(i)\) of the mutant in a population with \(i\) mutants: \begin{align} \label{eq:recursive} \rho(i) = \frac r{1+r}\ \rho(i-1)+\frac 1{1+r}\ \rho(i+1). \end{align} Thus, the dynamics corresponds to a biased random walk with absorbing boundaries. Eq. 1 admits two solutions \(\rho = 1\) and \(\rho = 1/{r^i}\). The absorbing boundaries additionally require \(\rho(0)=0\) and \(\rho(N)=1\). For \(r\neq 1\), the fixation probability of a single mutant \(\rho_1\) then becomes \[ \rho_1 = \frac{\displaystyle 1-\frac1r}{\displaystyle 1-\frac1{r^N}}. \] Assuming that mutations are rare events \(\rho_1\) is of particular interest. It is easy to see that a neutral mutant (\(r=1\)) has a fixation probability of \(\rho_1=1/N\): eventually the entire population will have a single common ancestor but in terms of fitness mutants and residents are indistinguishable and so every member of the population has equal chances to be the chosen one. Evolution is said to favor a mutant if the fixation probability of the mutant exceeds the fixation probability of a neutral mutant, \(\rho_1 >1/N\).
Spatial Moran process
The Moran process can be easily generalized to structured populations or graphs by restricting step 2 above such that the offspring of the focal individual replaces one of its neighbours rather than a random member of the population.
Publications
- Lieberman, E., Hauert, C. & Nowak, M. (2005) Evolutionary dynamics on graphs Nature 433 312-316 doi: 10.1038/nature03204.
- Hauert, C. (2008) Evolutionary Dynamics p. 11-44 in Evolution from cellular to social scales eds. Skjeltorp, A. T. & Belushkin, A. V., Springer Dordrecht NL.
- Jamieson-Lane, A. & Hauert, C. (2015) Fixation probabilities on superstars, revisited and revised J. Theor. Biol. 382 44-56 doi: 10.1016/j.jtbi.2015.06.029.
Press & News
- Guimerà, R. & Sales-Pardo, M. (2006) Form follows function: the architecture of complex networks Molecular Systems Biology 2 42 doi: 10.1038/msb4100082.
References
- Moran, P. A. P. (1962) Random processes in genetics Proc. Cambridge Phil. Soc. 54 60-71.
- Maruyama, T. (1974) A Simple Proof that Certain Quantities are Independent of the Geographical Structure of Population Theor. Pop. Biol. 5 148-154.
- Slatkin, M. (1981) Fixation probabilities and fixation times in a subdivided population Evolution 35 477-488.
