Evolutionary amplifiers: Difference between revisions
mNo edit summary |
No edit summary |
||
| Line 6: | Line 6: | ||
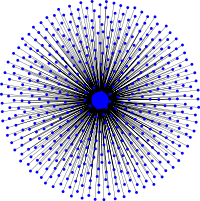
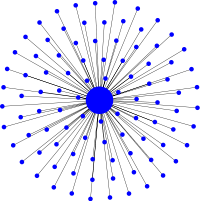
The simplest example of an evolutionary amplifier is the [https://en.wikipedia.org/wiki/Star_(graph_theory) star graph], which connects a central hub to a reservoir of leaf vertices through undirected (bi-directional) links. The hub represents a bottleneck for the evolutionary progression because if one leaf vertex is occupied by a mutant it needs to conquer the hub before another leaf vertex can be taken over. Most of the time, the ‘hot’ hub is repeatedly replaced by reproducing leaf vertices and only occasionally the hub itself reproduces and replaces a leaf vertex. For an advantageous mutant in a leaf vertex this means that compared to a resident leaf vertex it has a relative advantage of \(r\) to occupy the hub and similarly the mutant hub has again a relative reproductive advantage of \(r\). Thus, the overall relative advantage of a mutant leaf vertex to proliferate and occupy another leaf vertex is \(r^2\). Note that there is no other way for a mutant to spread through the population. As a consequence, a mutant with fitness \(r^2\) on the star graph has (approximately) the same fixation probability as a mutant with fitness \(r^2\) on a circulation graph. Thus, the fixation probability is approximately | The simplest example of an evolutionary amplifier is the [https://en.wikipedia.org/wiki/Star_(graph_theory) star graph], which connects a central hub to a reservoir of leaf vertices through undirected (bi-directional) links. The hub represents a bottleneck for the evolutionary progression because if one leaf vertex is occupied by a mutant it needs to conquer the hub before another leaf vertex can be taken over. Most of the time, the ‘hot’ hub is repeatedly replaced by reproducing leaf vertices and only occasionally the hub itself reproduces and replaces a leaf vertex. For an advantageous mutant in a leaf vertex this means that compared to a resident leaf vertex it has a relative advantage of \(r\) to occupy the hub and similarly the mutant hub has again a relative reproductive advantage of \(r\). Thus, the overall relative advantage of a mutant leaf vertex to proliferate and occupy another leaf vertex is \(r^2\). Note that there is no other way for a mutant to spread through the population. As a consequence, a mutant with fitness \(r^2\) on the star graph has (approximately) the same fixation probability as a mutant with fitness \(r^2\) on a circulation graph. Thus, the fixation probability is approximately | ||
\begin{align} | \begin{align} | ||
\rho_2 = \frac{\displaystyle 1-\frac1{r^2}}{\displaystyle 1-\frac1{r^{2N}}} | \rho_2 = \frac{\displaystyle 1-\frac1{r^2}}{\displaystyle 1-\frac1{r^{2N}}} | ||
\end{align} | \end{align} | ||
for a star graph of size \(N\). The approximation improves for large \(N\) and becomes exact in the limit \(N\to\infty\). | for a star graph of size \(N\). The approximation improves for large \(N\) and becomes exact in the limit \(N\to\infty\). | ||
| Line 61: | Line 61: | ||
The intriguing dynamical features of evolutionary amplifiers have first been reported by [[#Publications|Lieberman et al. (2005)]]. However, the formula for the fixation probabilities reported therein has resulted in a controversy that took time and effort to resolve. Lieberman et al. (2005) originally derived the fixation probability of a single mutant with fitness \(r\) on a superstar graph as | The intriguing dynamical features of evolutionary amplifiers have first been reported by [[#Publications|Lieberman et al. (2005)]]. However, the formula for the fixation probabilities reported therein has resulted in a controversy that took time and effort to resolve. Lieberman et al. (2005) originally derived the fixation probability of a single mutant with fitness \(r\) on a superstar graph as | ||
\begin{align}\label{eq:nature05} | \begin{align}\label{eq:nature05} | ||
\rho_k = \dfrac{1-\dfrac1{r^k}}{1-\dfrac1{r^{kN}}}. | \rho_k = \dfrac{1-\dfrac1{r^k}}{1-\dfrac1{r^{kN}}}. | ||
\end{align} | \end{align} | ||
| Line 73: | Line 72: | ||
\begin{align} | \begin{align} | ||
\label{eq:jtb05} | \label{eq:jtb05} | ||
1-\dfrac1{r^4(k-1)\left(1-\frac1r\right)^2} \leq \rho_k \leq 1-\dfrac1{1+r^4(k-1)} | 1-\dfrac1{r^4(k-1)\left(1-\frac1r\right)^2} \leq \rho_k \leq 1-\dfrac1{1+r^4(k-1)} | ||
\end{align} | \end{align} | ||
although the bounds are not as tight anymore. At the same time, the lower bound in this idealized limit is consistently too high. Quite surprisingly, this indicates that even for \(B=M=200\), which translates to a population size of \(N\approx40'000\), finite size effects remain significant. Although, the primary cause for the finite size effects is easily accounted for because it simply relates to the chance that a randomly placed mutant ends up in one of the chains (or the hub) and hence almost certainly goes extinct. | although the bounds are not as tight anymore. At the same time, the lower bound in this idealized limit is consistently too high. Quite surprisingly, this indicates that even for \(B=M=200\), which translates to a population size of \(N\approx40'000\), finite size effects remain significant. Although, the primary cause for the finite size effects is easily accounted for because it simply relates to the chance that a randomly placed mutant ends up in one of the chains (or the hub) and hence almost certainly goes extinct. | ||
Revision as of 20:05, 13 April 2022
Evolutionary amplifiers are probably the most intriguing structures in evolutionary graph theory and represent the counterpart to evolutionary suppressors. For the spatial Moran process these population structures tilt the balance between selection and random drift in favor of selection such that the fixation probabilities \(\rho\) of advantageous mutants (\(r>1\)) is larger than in the original Moran process or on circulation graphs, \(\rho>\rho_1\). Because selection is enhanced, this also implies that disadvantageous mutants (\(r<1\)) have a smaller fixation probability, \(\rho<\rho_1\). Evolutionary amplifiers are also characterized by hierarchical population structures with the crucial addition of positive feedback loops.
The simplest example of an evolutionary amplifier is the star graph, which connects a central hub to a reservoir of leaf vertices through undirected (bi-directional) links. The hub represents a bottleneck for the evolutionary progression because if one leaf vertex is occupied by a mutant it needs to conquer the hub before another leaf vertex can be taken over. Most of the time, the ‘hot’ hub is repeatedly replaced by reproducing leaf vertices and only occasionally the hub itself reproduces and replaces a leaf vertex. For an advantageous mutant in a leaf vertex this means that compared to a resident leaf vertex it has a relative advantage of \(r\) to occupy the hub and similarly the mutant hub has again a relative reproductive advantage of \(r\). Thus, the overall relative advantage of a mutant leaf vertex to proliferate and occupy another leaf vertex is \(r^2\). Note that there is no other way for a mutant to spread through the population. As a consequence, a mutant with fitness \(r^2\) on the star graph has (approximately) the same fixation probability as a mutant with fitness \(r^2\) on a circulation graph. Thus, the fixation probability is approximately \begin{align} \rho_2 = \frac{\displaystyle 1-\frac1{r^2}}{\displaystyle 1-\frac1{r^{2N}}} \end{align} for a star graph of size \(N\). The approximation improves for large \(N\) and becomes exact in the limit \(N\to\infty\).
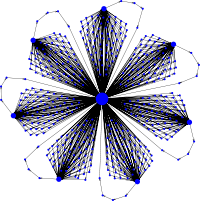
The essential features of the star graph can be generalized by introducing a series of sequential bottlenecks that further increase amplification. The best studied example is the superstar graph, which consists of \(B\) branches, each with a reservoir of \(M\) vertices that feed into a central hub via a directed chain of length \(k-2\), where \(k\) denotes a structural parameter indicating the number of steps required to reach any reservoir vertex from any other one. Thus, the overall population size is \(N=B(M+k-2)+1\). The strength of the evolutionary amplifier relates to \(k\), which determines the number of bottlenecks. Most intriguingly, the limit \(k\to\infty\) (as well as \(N\to\infty\) with \(B=M\)) results in a perfect amplifier that guarantees fixation of even the slightest beneficial mutation, while ensuring the certain extinction of any detrimental mutation. The detailed derivation of the fixation probabilities on superstar graphs has been somewhat controversial and is discussed below. Interestingly, the ability of a graph to amplify selection seems to come at a price in the sense that fixation times tend to increase. Thus, even though a perfect amplifier may guarantee fixation it may take arbitrarily long to do so. The details and the nature of this trade-off are active research topics.
Evolutionary dynamics on amplifier graphs
Evolutionary dynamics on the star graph
The star graph is the simplest graph that amplifies selection and reduces random drift. The evolutionary dynamics is determined by the feedback between the fast updating of the hub and the slow updates of leaf vertices, which act as a reservoir for mutants. The hub creates a bottleneck, which results in three characteristic phases of the invasion process of beneficial mutants: (i) as long as mutants are rare, changes in the population are slow. Mutants in reservoir vertices rarely reproduce but also rarely get replaced, which effectively protects mutants from early extinction. (ii) once mutants become slightly more common changes happen quickly and they rapidly establish the majority in the population. (iii) in the last phase the dynamics slows down again until every last resident vertex has been replaced. Note just as rare mutants in the initial phase, rare 'residents' also get rarely replaced and hence enjoy a similar protection from extinction but it is just less efficient than those of beneficial mutants due to the residents' fitness disadvantage.
Evolutionary dynamics on the superstar graph
Superstar graphs have the amazing ability to act as arbitrarily strong amplifiers of selection. This means that any, even slightly beneficial mutation is guaranteed to fixate in the population on sufficiently large graphs. The dynamics of superstars is also determined by the feedback between few fast and many slow updating vertices but the bottleneck is even more pronounced than on the star graph by introducing a hierarchical sequence of levels where selection can act upon. The resulting invasion dynamics of beneficial mutants exhibits the same three characteristic phases as on the star graph with the only difference that phase (i) seems to take longer, while phase (ii) is fast and (iii) seems a little faster.
Fixation probabilities on evolutionary amplifiers
Fixation probabilities on the star graph
The key feature of evolutionary amplifiers is that they increase the fixation probability of advantageous mutants above the corresponding fixation probability on circulations and lower that of disadvantageous mutations. For sufficiently small graphs this can be illustrated through simulations determining the fixation probabilities for every vertex. In particular this demonstrates that the fixation probability for a mutant arising in the hub is essentially zero because the hub is a hot vertex that gets replaced most of the time with only a small chance to reproduce itself. Note that the star graph cannot be too small because then finite size effects start to matter and result in deviations from the analytical approximation stating that fixation probabilities on the star graph correspond to those of a mutant with fitness \(r^2\) on a circulation.

Fixation probabilities on the superstar graph
Superstars are the most potent evolutionary amplifiers studied in detail. Most intriguingly, they can guarantee fixation of any advantageous mutant (and certain extinction of disadvantageous ones) in the limit of (very) large population sizes. For small superstars, simulations illustrate the increase in fixation probabilities for every vertex. Compared to the star graph, superstars have more hot vertices (the hub and the first vertex of each linear chain) that all have very small fixation probabilities. Similarly, mutants in chain vertices also have small chances to take over the population. As a consequence, finite size effects have a significant impact on the fixation probability on superstars.
Fixation times on evolutionary amplifiers
Fixation times on the star graph
For fixation times on the star graph an analytical approximation is available (Frean et al. 2013) but results in rather unwieldy expressions. Fixation times for the hub or leaf vertices are essentially the same because if the mutant arises in the hub, it either gets wiped out immediately or succeeds in reproducing and placing an offspring in the reservoir, which creates the same situation as if the mutant had occurred in a leaf only that the latter course of events is highly unlikely. Consequently, absorption times for the hub are very small.
Fixation times on the superstar graph
Little is known about fixation times on superstar graphs, except that increases in fixation probabilities seem to come at the expense of longer fixation times. However, compared to the star graph, fixation times may actually be shorter despite higher fixation probabilities. Hot vertices (hub and first nodes of linear chains) and, to a lesser degree, the other nodes in the linear chain (due to their exposed locations) have low absorption times, or, equivalently, small fixation probabilities. In contrast, mutants in the reservoirs are fairly well protected from accidental extinction during the critical early invasion phase.
Fixation probabilities on superstars
The intriguing dynamical features of evolutionary amplifiers have first been reported by Lieberman et al. (2005). However, the formula for the fixation probabilities reported therein has resulted in a controversy that took time and effort to resolve. Lieberman et al. (2005) originally derived the fixation probability of a single mutant with fitness \(r\) on a superstar graph as \begin{align}\label{eq:nature05} \rho_k = \dfrac{1-\dfrac1{r^k}}{1-\dfrac1{r^{kN}}}. \end{align}
For \(k=2\) this approximates the fixation probability for the star graph, \(\rho_2\). Note that it is only an approximation because of (i) a small chance that the hub vertex is selected to reproduce several times in a row and (ii) because the fixation probability of a mutant that arises in the hub is very close to zero. The formula becomes exact in the limit \(N\to\infty\) because then the finite size corrections vanish. The exact formula for the star graph is derived in Broom & Rychtář (2008). Similarly, Eq. \ref{eq:nature05} has been confirmed for the superstar with \(k=3\) (Houchmandzadeh & Vallade, 2011). However, for \(k=5\) Díaz et al. (2013) have reported an upper bound for the fixation probability \(\rho_5\): \[\rho_5 \leq 1-\frac{r+1}{2r^5 + r + 1}\] in the limit \(N\to\infty\). For beneficial mutants with \(r\geq 1.42\) this results in a contradiction when compared to Eq. \ref{eq:nature05} in the same limit: \[\rho_k = 1-\frac1{r^k}.\]
Upon closer inspection it turns out that the original formula, Eq. \ref{eq:nature05}, was far too optimistic in terms of the strength of amplification for \(k\geq5\). The reasons for this overestimation, however, are rather subtle and relate to the fact that the states of neighbouring vertices along each directed chain feeding into the hub are highly correlated (Jamieson-Lane & Hauert, 2015). In essence, this reduces the amplification from exponential in \(k\) to just a linear factor. Although an exact formula for the fixation probability on superstars is inaccessible, rather tight upper and lower bounds on \(\rho_k\) can be derived. In the limit \(N\to\infty\) the formula becomes significantly simpler and reduces to \begin{align} \label{eq:jtb05} 1-\dfrac1{r^4(k-1)\left(1-\frac1r\right)^2} \leq \rho_k \leq 1-\dfrac1{1+r^4(k-1)} \end{align} although the bounds are not as tight anymore. At the same time, the lower bound in this idealized limit is consistently too high. Quite surprisingly, this indicates that even for \(B=M=200\), which translates to a population size of \(N\approx40'000\), finite size effects remain significant. Although, the primary cause for the finite size effects is easily accounted for because it simply relates to the chance that a randomly placed mutant ends up in one of the chains (or the hub) and hence almost certainly goes extinct.
Eq. \ref{eq:jtb05} resolves the controversy around fixation probabilities on superstars while confirming the original claim that it is possible, in principle, to construct a perfect amplifier - even though much larger graphs are required than previously thought to achieve the same amplification effect.
Publications
- Lieberman, E., Hauert, C. & Nowak, M. (2005) Evolutionary dynamics on graphs Nature 433 312-316 doi: 10.1038/nature03204.
- Jamieson-Lane, A. & Hauert, C. (2015) Fixation probabilities on superstars, revisited and revised J. Theor. Biol. 382 44-56 doi: 10.1016/j.jtbi.2015.06.029.
References
- Broom, M. & Rychtář, J. (2008) An analysis of the fixation probability of a mutant on special classes of non-directed graphs Proc. R. Soc. A 464 2609-2627 doi: 10.1098/rspa.2008.0058.
- Díaz, J., Goldberg, L. A., Mertzios, G. B., Richerby, D., Serna, M. & Spirakis, P. G. (2013) On the fixation probability of superstars Proc. R. Soc. A 469 20130193 doi: 10.1098/rspa.2013.0193.
- Frean M., Rainey P. B., & Traulsen A. (2013) The effect of population structure on the rate of evolution Proc R Soc B 280 20130211 doi: 10.1098/rspb.2013.0211.
- Houchmandzadeh, B. & Vallade, M. (2011) The fixation probability of a beneficial mutation in a geographically structured population New J. Phys. 13 073020 doi: 10.1088/1367-2630/13/7/073020.