
Mutualisms: cooperation between species
In mutualistic associations two species cooperate by exchanging goods or services with members of another species for their mutual benefit. At the same time competition for reproduction primarily continues with members of their own species. In intra-species interactions the prisoner's dilemma is the leading mathematical metaphor to study the evolution of cooperation. Here we consider inter-species interactions in the spatial prisoner's dilemma, where members of each species reside on one lattice layer. Cooperators provide benefits to neighbouring members of the other species at a cost to themselves. Hence, interactions occur across layers but competition remains within layers. We show that rich and complex dynamics unfold when varying the cost-to-benefit ratio of cooperation, \(r\). Four distinct dynamical domains emerge that are separated by critical phase transitions, each characterized by diverging fluctuations in the frequency of cooperation: (i) for large \(r\) cooperation is too costly and defection dominates; (ii) for lower \(r\) cooperators survive at equal frequencies in both species; (iii) lowering \(r\) further results in an intriguing, spontaneous symmetry breaking of cooperation between species with increasing asymmetry for decreasing \(r\); (iv) finally, for small \(r\), bursts of mutual defection appear that increase in size with decreasing \(r\) and eventually drive the populations into absorbing states. Typically one species is cooperating and the other defecting and hence establish perfect asymmetry. Intriguingly and despite the symmetrical model setup, natural selection can nevertheless favour the spontaneous emergence of asymmetric evolutionary outcomes where, on average, one species exploits the other in a dynamical equilibrium.
The problem of cooperation
The evolution and maintenance of cooperation ranks among the most fundamental questions in biological, social and economical systems. Cooperators provide benefits to others at a cost to themselves. Cooperation is a conundrum because on the one hand everyone benefits from mutual cooperation but on the other hand individuals face the temptation to increase their personal gains by defecting and withholding cooperation. This generates a conflict of interest between the group and the individual, which is termed a social dilemma. The prisoner's dilemma is the most popular mathematical metaphor of a social dilemma and theoretical tool to study cooperation through evolutionary game theory.
Donation game
In the simplest and most intuitive instance of the prisoner's dilemma, the donation game, two players meet and decide whether to cooperate and provide a benefit \(b\) to their interaction partner at a cost \(c\) (\(b>c>0\)) or to defect, which entails no costs and provides no benefits. If both cooperate each gets \(b-c\) but if one defects then the defector gets \(b\) and shirks the costs of cooperation, while the cooperator is stuck with the costs \(-c\). Finally if both defect, no one gets anything. The interaction is conveniently summarized in a payoff matrix (for the row player):
\begin{array}{cc} \tag{1} \label{eq:dg} & C\qquad D\\ \begin{matrix} C\\D \end{matrix} & \begin{pmatrix} b-c & -c\\ b & 0 \end{pmatrix} \end{array}
Thus, both players prefer mutual cooperation over mutual defection, yet defection yields the higher payoff regardless of what the partner does and hence the conflict of interest arises.
The problem of cooperation is exacerbated for actions that bestow benefits not just to other individuals but to those of another species. In particular it is crucial to clearly distinguish between the acts of cooperation of an individual and mutualistic interactions between individuals. Accomplishing mutually beneficial interactions requires coordination of cooperative acts between species.
Here we focus on the simplest setup with two identical species of equal population size each following the same ecological and evolutionary updating process.
Well-mixed populations
In intra-species interactions with random interactions, a so-called well-mixed population, the payoffs to cooperators and defectors soleley depends on their frequencies. In this case the replicator equation describes the change in the frequency of cooperators, \(x\), in a population as a function of the expected payoffs of cooperators and defectors, \(\xi_C\) and \(\xi_D\), respectively:
\begin{align} \label{eq:re} \tag{2} \dot x &= x(\xi_C - \bar\xi) = x(1-x)(\xi_C - \xi_D)\\ \end{align}
where \(\xi_C=x b-c\), \(\xi_D=x b\), and \(\bar\xi = x\xi_C+(1-x)\xi_D\) denotes the average payoff in the population. Since \(\dot x\lt 0\) for all \(x\), the frequency of cooperators decreases and eventually goes extinct. This is the well-known result that cooperation is not evolutionarily stable in the prisoner's dilemma.
In inter-species interactions it is of crucial importance to distinguish between cooperation -- costly acts of individuals that benefit others -- and mutualistic interactions, where both parties benefit from the interaction. For the inter-species donation game cooperators of one species, \(X\), provide benefits to members of another species, \(Y\), at a cost to themselves. In well-mixed populations, where members of one species interact with random individuals of the other species, the corresponding two-species replicator equation, for the frequencies of cooperators \(x\) in one species and \(y\) in the other, is given by
\begin{align} \label{eq:remut} \tag{3} \dot x &= x(\xi_C - \bar\xi)\\ \dot y &= y(\zeta_C - \bar\zeta), \end{align}
where \(\xi_C=y b_x-c_x\) and \(\zeta_C=x b_y-c_y\) denote the expected payoffs for cooperators in species \(X\) and \(Y\) with costs \(c_x, c_y\) and benefits \(b_x, b_y\), respectively. Defectors equally reap the benefits but bear no costs, \(\xi_D=y b_x\) and \(\zeta_D=x b_y\), respectively. Note, the benefits to either species depend on the frequency of cooperators in the other species, who also bears the costs of cooperation. The average payoff to each species is \(\bar\xi = x \xi_C + y \xi_D = y b_x-x c_x\) and \(\bar\zeta = x \zeta_C + y \zeta_D = x b_y-y c_y\), respectively.
Eq. \eqref{eq:remut} reduces to \(\dot x = x(1-x)(-c_x) \lt 0\) and \(\dot y = y(1-y)(-c_y) \lt 0\) such that in both species cooperators dwindle and eventually go extinct. Interestingly, this happens regardless of the magnitude of foregone benefits, \(b_x,b_y\). Thus, unsurprisingly the demise of cooperation in inter-species interactions remains unchanged.
For simplicity we assume that species \(X\) and \(Y\) face the same donation game, with costs \(c=c_x=c_y\) and benefits \(b=b_x=b_y\). Thus, \(X\) and \(Y\) are interchangeable labels. Rescaling reduces the interaction in Eq. \eqref{eq:dg} to a single parameter:
\begin{equation} \label{eq:dgr} \tag{4} {\bf A}= \begin{pmatrix} 1-r & -r\\ 1 & 0 \end{pmatrix}, \end{equation}
where \(r=c/b\) denotes the cost-to-benefit ratio with \(0\lt r\lt 1\).
Spatial populations

In order to delineate effects of spatial dimensions on cooperation in mutualistic interactions, we consider two parallel, square lattice layers with \(N=L \times L\) sites each, where \(L\) refers to the linear lattice dimension. Each site is occupied by one individual with \(k=4\) neighbours under periodic boundary conditions. One layer represents species \(X\) and the other species \(Y\): individuals in each layer interact with their \(k+1\) nearest neighbours on the other layer but compete with \(k\) neighbours in their own layer, see figure.
Dynamical domains
In spatial settings the formation of clusters reduces exploitation and increases interactions with other cooperators to make up for losses against defectors. Spatial assortment enables co-existence. This results in four dynamical domains depending on the cost-to-benefit ratio of cooperation, \(r\):
- \(r>r_1\): defection dominates. For high costs or low benefits, spatial correlations are insufficient to support cooperation and both populations evolve towards the absorbing \(DD\) state. The outcome is the same as in well-mixed populations, see \eqref{eq:remut}.
- \(r_2<r<r_1\): cooperators and defectors co-exist. The frequency of cooperators in the dynamical equilibrium is equal in both layers and increases for decreasing \(r\).
- \(r_3<r<r_2\): spontaneous symmetry breaking. Cooperators and defectors continue to co-exist in a dynamical equilibrium but with essentially complementary strategy frequencies in the two layers.
- \(0<r<r_3\): relaxation into asymmetric absorbing states \(CD\) or \(DC\). The emergence, growth and elimination of homogeneous domains of defection (\(DD\) regions) drive spikes (or bursts) in defector frequencies.
The four dynamical regimes are separated by three different types of critical phase transitions.
Symmetric cooperation: random walk
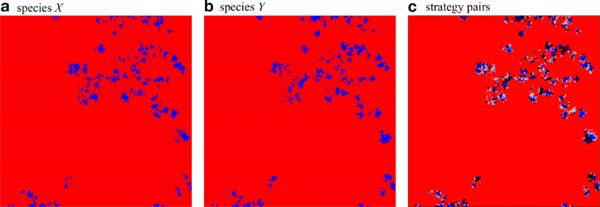
The spatial configuration of cooperators, \(\blacksquare\), and defectors, \(\blacksquare\) for each species separately, a and b, as well as for strategy pairs, c, with \(CC\) \(\blacksquare\), \(DD\) \(\blacksquare\), \(CD\) \(\blacksquare\) and \(DC\) \(\blacksquare\) in the symmetric phase close to but below the directed percolation threshold, \(r=0.0225<r_1\): Strongly correlated clusters of cooperators on both layers perform a coordinated branching and annihilating random walk. Parameters: \(200\times200\) region of a \(1000\times1000\) lattice with \(K=0.1\). Click image for interactive online simulations.
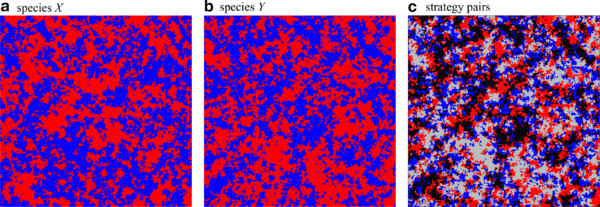
The spatial configuration of cooperators, \(\blacksquare\), and defectors, \(\blacksquare\) for each species separately, a and b, as well as for strategy pairs, c, with \(CC\) \(\blacksquare\), \(DD\) \(\blacksquare\), \(CD\) \(\blacksquare\) and \(DC\) \(\blacksquare\) in the symmetric phase close to but above the symmetry breaking, \(r=0.005>r_2\): Almost identical frequencies of cooperators and defectors establish in both layers. The similar frequencies of all four strategy pairs indicate that the layers are essentially uncorrelated. Switching the labels of species \(X\) and \(Y\) in a, b merely switches the role of \(CD\) and \(DC\) pairs, \(\blacksquare\) \(\leftrightarrow\blacksquare\). Parameters: \(200\times200\) region of a \(1000\times1000\) lattice with \(K=0.1\).
Asymmetric cooperation
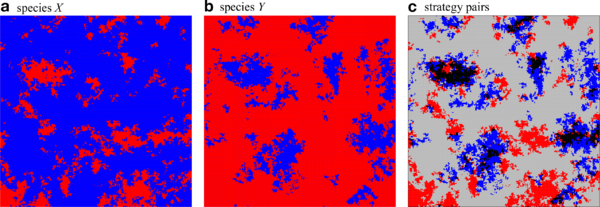
Typical spatial strategy distribution in the asymmetric phase with essentially complementary frequencies and distributions of cooperators and defectors in the two layers. Parameters are the same as in the previous figures but with \(r=0.0015\).
Bursts of defection
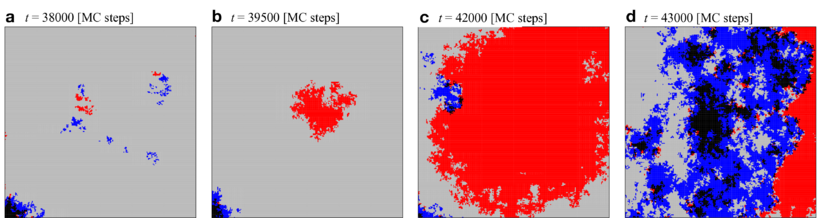
Snapshots a-d illustrate the spatial distribution of the four strategy pairs between lattices, \(CC\) \(\blacksquare\), \(DD\) \(\blacksquare\), \(CD\) \(\blacksquare\) and \(DC\) \(\blacksquare\), during a \(DD\) burst within a \(240\times240\) region of a \(1000\times1000\) lattice.
First, small islands of \(CC\) and \(DD\) pairs move, collide, and disappear at random in a large domain of \(CD\) pairs (a). These islands are continuously created along the boundary separating large \(CD\) and \(DC\) domains (a lower left corner). Most islands eventually go extinct. Only sufficiently large \(DD\) areas occasionally expand (b). The \(DD\) domain grows until it collides with a small \(CC\) island, which invades its territory (c). However, the \(CC\) domains are not stable against invasion of \(CD\) or \(DC\) phases (d). Subsequently, the strategy distribution evolves slowly toward the initial distribution (a).
Critical phase transitions


Directed percolation

Spontaneous symmetry breaking

Bursts of defection

References
- Hauert, C. & Szabó, G. (2024) Spontaneous symmetry breaking of cooperation between species, PNAS Nexus (in print) doi: 10.1093/pnasnexus/pgae326