Spatial Moran process
The spatial Moran process models stochastic evolution in structured populations. Population structure is represented by graphs where each vertex represents an individual and links define the neighbourhood of each individual. The graph can have any structure – for example, square lattices describe spatially extended systems, small-world networks (Watts & Strogatz, 1998) or scale-free networks (Barabasí & Albert, 1999) model social structures – and links between vertices may have different strengths. Links can even be directed such that one individual is a neighbour of another but not vice versa. A fully connected graph, where each vertex is equally linked to every other vertex, is essentially equivalent to an unstructured population.
The essential difference to the original Moran process that arises through the population structure is that the offspring of the focal individual replaces a random neighbour instead of a random member of the population. An additional minor difference is that the offspring cannot replace the focal individual but, in principle, this can be implemented by adding loops to each vertex.
Provided that the graph is connected, i.e. each vertex is connected to every other vertex through a series of links, the population maintains the same two absorbing states with all residents or all mutants as in the absence of structure. If the graph is not connected, mutant fixation is impossible.
Evolutionary dynamics
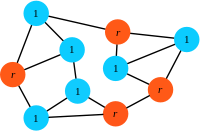
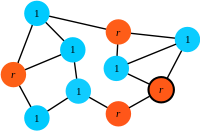
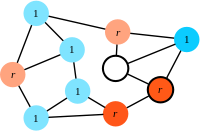
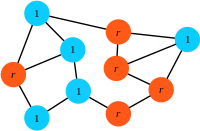
In the simplest case, the population is composed of residents (blue) and mutants (orange):

Setup: The state of the population is given by the configuration of residents (blue, fitness \(1\)) and mutants (orange, fitness \(r\)) on a graph. In this sample graph all links are undirected (bi-directional).

Step 1: At each time step a focal individual is chosen for reproduction with a probability proportional to its fitness (here, a mutant is selected for reproduction).

Step 2: A randomly chosen 'neighbour' of the focal individual (vivid colours) is eliminated (here, a resident is selected for death).

Step 3: The offspring replaces the eliminated individual.
As in the original Moran process, the above steps are repeated until either one of the two absorbing states is reached: a homogeneous state of either all residents (mutant went extinct) or all mutants (resident displaced). No other stable equilibrium state is possible provided that the graph is connected
Publications
- Lieberman, E., Hauert, C. & Nowak, M. (2005) Evolutionary dynamics on graphs Nature 433 312-316 doi: 10.1038/nature03204.
References
- Barabasí, A.-L. & Albert, R. (1999) Emergence of scaling in random networks Science 286 509–512.
- Watts, D. J. & Strogatz, S. H. (1998) Collective dynamics of 'small world' networks Nature 393 440–442.